I recently looked at whether there is a better way to measure unemployment than the standard measures. In it I made two fundamental criticisms about the common measurements of unemployment.
The first had to do with who was counted as “unemployed”. Various measures of unemployment diverge on whether you are unemployed if you don’t have a job, or whether you are only unemployed if you don’t have a job but are trying to find one. From an unemployed person’s point of view, I’m sure it doesn’t matter much whether you’re actively trying to find work or not. What matters is whether you did find work.
My other fundamental criticism had to do with the nature of the unemployment index itself. It is primarily backward looking. People who are out of work don’t care much about what the employment conditions were like in the past. They do care very much about what the job situation is like at that moment when they search for a job.
In short, the common unemployment statistics give a snap shot of the job situation at any moment in time, but it’s mostly irrelevant information. It’s just not the data that people should be concerned with.
To rectify these points I advocated using the steady-state unemployment rate (SSUR), otherwise commonly called the “natural rate of unemployment.” (I avoid using the term “natural rate” of unemployment because it implies that it is natural that people should not work, or work for that matter, and I don’t think that either view is particularly correct.)
The nice result from using the SSUR is that it gives an unemployment rate determined by the hiring and firing decisions made at that moment. In effect it gives a more up-to-date unemployment overview than the other backward-looking measures.
Still, unemployed people shouldn’t care much about the total amount of jobless people in the economy. If you are searching for a job there is a binary result – you either get one or you don’t. Knowing that such-and-such percent of all eligible workers do not currently have a job is little help to you.
The unemployed person is concerned with what the odds are that he will find a job over, say, the coming month. This is a much different question than how many people are currently out of work.
Every month there are some people separated from their jobs. You can think of this as people getting fired, but it is also those who leave their posts of their own volition, e.g., for retirement. There is also a sum of workers who find a new job each month. The SSUR looked at the ratio between those being separated and the total moving into or out of work as a way to gauge unemployment.
We can think of this in other, more useful terms, however.
The difference between the sum of those finding work and those being separated from their jobs is the net amount of new hires in the economy. In March of this year, the United States had a positive balance of 186,000 new hires. Often times this number increases during Christmas time, as stores hire temporary workers to help with the season. For example, in November 2013 there were nearly 260,000 net new hires.
The last month that the United States had net “fires”, that is, more people being separated from their job than finding one, was February 2010, when there were 45,000 more separations than hires.
These net figures are relevant for job seekers. They are also relevant for people with a job.
If the amount of net hires is positive it means that some unemployed people now have a job. If the figure is negative it means that some employed people lost a job.
To make sense of these numbers, in figure 1 I have constructed the “net job finding rate” (NJF). When the number of net hires is positive I have expressed it as a percentage of all unemployed people. When the number of net hires is negative I have expressed it as a percentage of all employed workers.
In effect the NJF shows you what percentage of unemployed workers find a job each month, or conversely what percentage of all employed workers lost a job. This is a little more complicated to interpret than the standard unemployment rate, but as we will see it is much more useful to workers.
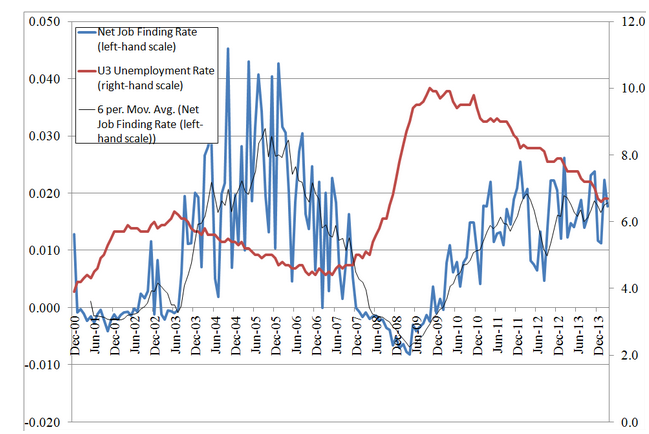
Figure 1: Net job finding rate vs. the standard unemployment figure
In recent history, the best month for unemployed workers was October 2004 when 4.5% of all unemployed workers found a job. Not bad. If you were to look at the standard unemployment measure you probably wouldn’t think that was a particularly great month for the unemployed. After all, the official unemployment rate was 5.5%, still quite high relative to the figure two years later at the peak of the boom.
The peak of the employment boom was March 2007, with unemployment at 4.4%. This might be a very low average figure of total unemployed workers, but for the average unemployed people it was not a very productive month. Only 2% of those unfortunate souls found a job that month.
March and April of 2009 were the worst months for American workers in recent history. Each one of those months nearly 1% of all employed people were separated from their jobs. The official unemployment rate was nowhere near its peak at that point, still having two more percentage points to go.
Since the month-to-month number of net hires is quite volatile (because of seasonal industries) I have included a 6-month moving average to smooth the results.
Even though the unemployment rate was still north of 8% in early 2012, the average number of unemployed finding work was a healthy 2%. Today the unemployment rate is lower, but there is also a lower percentage of unemployed people finding work. In short, even though the total employment situation might be better today than it was two years ago, the average unemployed worker is going to have a more difficult time finding a job.
In fact, the average unemployed worker today has about as good a chance of becoming employed as he had back at the end of the dot-com employment recession in mid-2003.
The Net Job Finding Rate is a measure that is actually useful for workers because it reflects the present employment situation. It might be a little more difficult to understand than the common measures, but at least it tells you how likely you are to find a job given current hiring and firing conditions.
Tags: data, economics, measure, methodology, Unemployment